New Zealand is leading the world with its use of data integration for research and analysis, and Stats NZ is at the forefront.
Stats NZ's Integrated Data is a critical tool in the government's efforts to reduce poverty, improve health, and support a growing, inclusive economy. It enables evidence-based insights, and measurement of the effectiveness of government initiatives and services.
The Integrated Data Infrastructure (IDI) and Longitudinal Business Database (LBD) are powerful integrated data tools that bring together information from government agencies, Stats NZ surveys, and non-government organisations.
Stats NZ, as steward of the IDI and LBD, looks after the technology of these databases and ensures researchers meet the access conditions that keep the data safe.
Stats NZ's world-leading Integrated Data tools
The IDI contains information about people and households and aims to include all people living in New Zealand. This allows researchers to compare outcomes across the population. It can shine a light on the impact events have in people's lives in areas such as education, income, benefits, migration, justice and health.
The LBD contains information about businesses, enabling researchers to look at groups of businesses across their lifetime to see how they develop and change. The LBD is linked to the IDI through tax data on employers and employees, allowing further analysis of the impact of events on people and businesses over time.

Detailed description of diagram
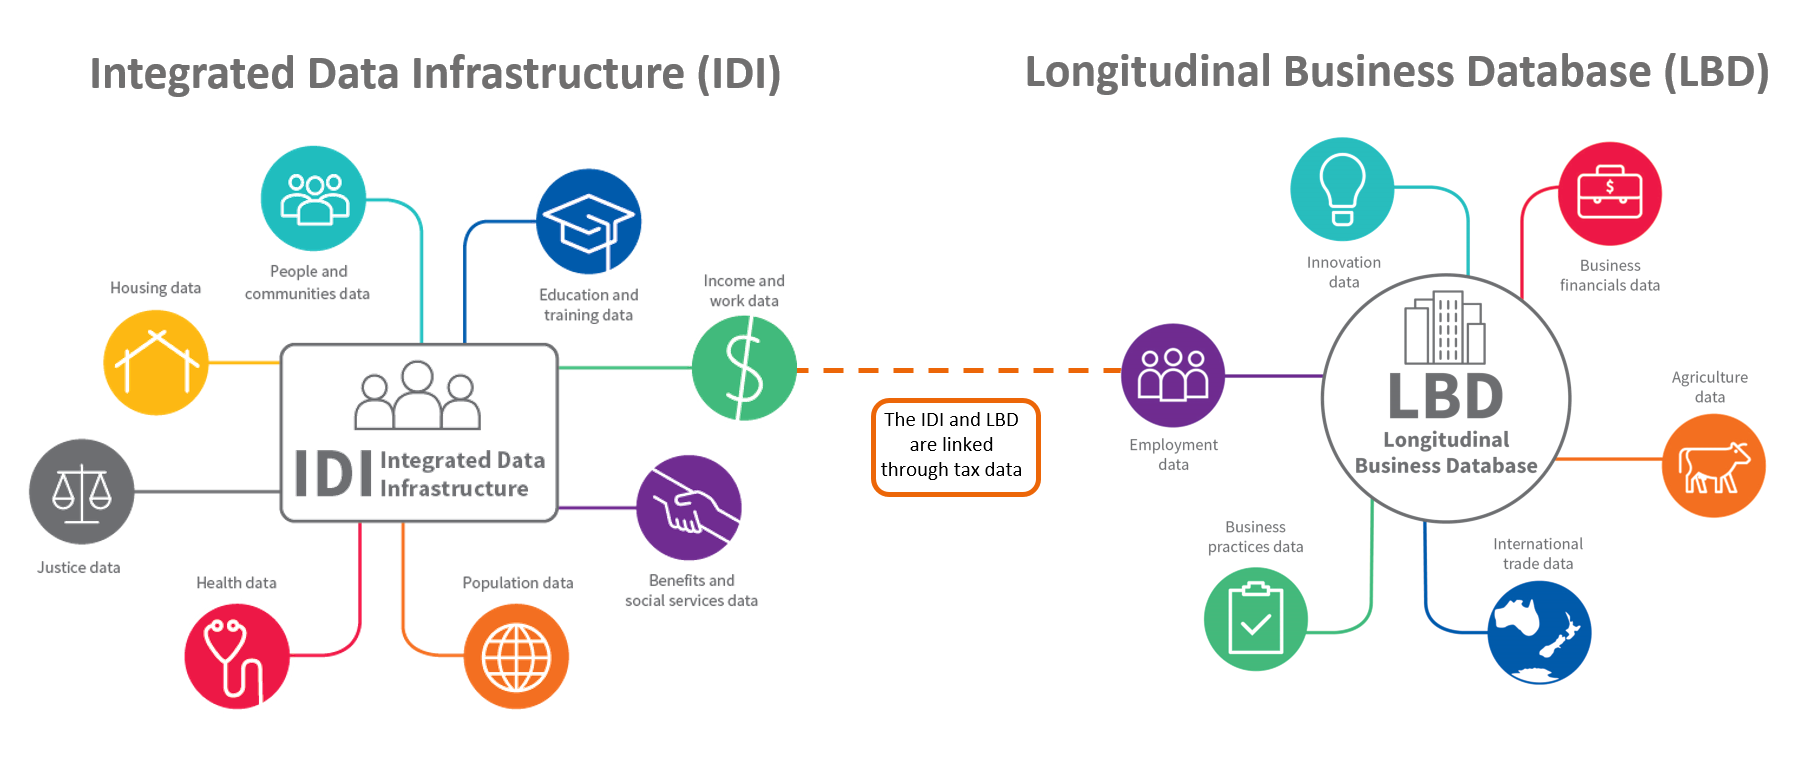
This diagram gives a basic overview of what kind of data is supplied to the Integrated Data Infrastructure (IDI) and Longitudinal Business Database (LBD) databases. Government agencies and non-government organisations provide data such as education data to Stats NZ to be linked to a central dataset called the 'spine'. The IDI spine aims to include all people living in New Zealand. The LBD spine aims to include all employees and employers so outcomes can be compared across the population. The diagram also shows how these two databases are linked to each other, providing further insights to researchers.
The diagram has two parts. On the left is a rectangle representing the spine of the IDI. Eight lines radiate out from the rectangle. At the end of each line is a circle that represents a category of data in the IDI. These circles are: people and communities' data, education and training data, income and work data, benefits and social services data, population data, health data, justice data and housing data.
On the right of the diagram is a circle representing the spine of the LBD. Six lines radiate out from the circle. At the end of each line is a circle that represents a category of data in the LBD. These circles are: innovation data, business financials data, agriculture data, international trade data, business practices data and employment data.
There is a dotted line running from the income and work data circle on the IDI side to the employment data circle on the LBD side. The line is labelled 'The IDI and LBD are linked through tax data'.
Responsible data custodians
The IDI and LBD are created by linking data originally collected for different purposes, through common variables. Their profiles and collation of a variety of data sources about individuals and businesses mean they pose particular security challenges.
Stats NZ is committed to safe access to integrated data, protection of individual privacy, and maintaining the public's trust and confidence. Stats NZ has in place a 'five safes' framework to keep data safe and ensure access to integrated data is only provided if all conditions in the framework are met. Before approved researchers access the IDI or LBD, they must prove their project is in the interest of the public good. Information that could identify individual people or businesses is removed or replaced. This keeps the data and privacy of people and businesses safe.
How Integrated Data is changing New Zealanders' lives
Researchers generate insights from integrated data which is used by policy and decision makers to improve the social and economic outcomes of New Zealanders.
Case study: Otago youth not in employment, education or training (NEET)
Stats NZ worked in partnership with the non-government organisation Methodist Mission Southern (MMS) to provide information about youth who were NEET. MMS uses data to understand the characteristics of NEET youth. This helps shape targeted, effective services to support young people in Otago to successfully manage their transition into employment or further education.
Video transcript
Video: 2:36 min, published 7 November 2017
Visual:
Camera pans over view of Dunedin city. Cuts to part of a sign saying Next Step Training.
Audio:
Background music.
Visual:
Woman talking to camera, background of house and trees. Cut to exterior of office, with sign ‘the methodist mission’.
Onscreen text: Pania Tulia – Client Support Worker, Next Step Training.
Audio:
You know, if Next Step wasn't here, or other places like Next Step, then there would be a huge number of students who would probably not have such a bright future.
Visual:
Man talking to camera, in front of bookshelves. Onscreen text: Jimmy McLauchlan – Business Development Leader, Methodist Mission Southern. Two teenage boys walking along street towards camera, one holding a skateboard. Onscreen graphic: school, education, employment. Two boys sitting, chatting, smiling.
Audio:
So, a NEET is a young person who's not in employment, education, or training. From our point of view we are interested in working with NEET youth who have just come from a school environment, possibly haven't had the kind of success they might have liked at school, may not have achieved any qualifications but are looking to get on a pathway into either further education or employment.
Visual:
Pania Tulia in front of house, talking to camera.
Audio:
Identifying their strengths but also highlighting to them, you know, that there's potential. So giving them hope when they're feeling like, you know, there's nothing left.
Visual:
Jimmy McLauchlan in office. The back of two boys sitting down on a bench outside.
Audio:
For us as a service provider, our job is to look at working with that young person to help remove some of their barriers to achievement or participation and also to help them develop some of those skills and resources that they need.
Visual:
Woman in office, with computer screen and chair behind her. Onscreen text: Laura Black – Chief Executive, Methodist Mission Southern, talking to camera. Camera view pans in on two boys leaning on fence, talking. Cut back to Laura talking.
Audio:
The more information you have the better choices you can make. It's not just the dataset around the NEETs but it's that dataset in conjunction with other data that we've got –- bus routes, schools, where we're getting kids from. It gives us insight and the opportunity to tailor and make choices around how we deploy our services and how we engage with other providers.
Visual:
Jimmy McLauchlan in office, talking to camera. Onscreen graphic Integrated Data Infrastructure IDI. Onscreen image of document Youth at risk: Identifying a target population (ages 20–24).
Audio:
Integrated data gives us a really holistic view of, of the person so we can say with a much higher degree of confidence ‘here's what's happening in that person's life, here's how we would look to work with them’. Gives us a really powerful and realistic view into the world that we haven't previously had.
Visual:
Laura Black in office, talking to camera.
Audio:
Then we can learn an awful lot about where we might be holding a shop front, or um holding a recruitment fair, or building relationships with a high school, or the intermediate even that's in that, in that area.
Visual:
Jimmy McLauchlan in office, talking to camera. Two boys standing outside, talking. Jimmy in office, talking to camera. Onscreen graphic of map, with shaded areas. Boy sitting outside, head bowed.
Audio:
Stats NZ team took the NEET youth data that they produced and turned it into effectively a colour-coded map that lets you just take a quick glance at a city and see based on a on a nice colourful diagram where some of the I guess more problematic areas are in terms of the distribution of NEET youth.
Visual:
Laura Black in office, talking to camera. The two boys walking, one with skateboard under arm.
Audio:
It's that data in conjunction with what we're experiencing in terms of our clients and our engagement that gives us a whole range of choices and insights.
Visual:
Pania Tulia, outside, talking to camera. Front shot of the two boys outside, sitting, talking to each other.
Audio:
It is about showing them that there’s hope. They've got just as much potential as anybody else um, and it's about having options and opportunities to have options.
Visual:
Onscreen text: Using integrated data to improve outcomes for young people at risk. Logos for The Methodist mission, Next Step Training, and StatsNZ Tatauranga Aotearoa. Better Data, Better Lives.
Audio:
Background music.
The future of Integrated Data
We are only just beginning to scratch the surface of what is possible with integrated data and Stats NZ is readying itself for the opportunities the future will bring.
The IDI has expanded beyond what was initially envisioned, both in terms of the data it contains and the number of users. Stats NZ is working on an expansion programme which will make the IDI and LBD easier to use, quicker and even more robust.
We are starting with simplifying and improving the way our customers access the IDI. This will increase the use and usability of the IDI, making more data available to a wider range of customers. This includes developing a tool that transforms a number of the most commonly used variables (like region most lived in and income) in the IDI into a more user friendly, visual format. Our goal is to build infrastructure that will work in a big data environment and increase usage of Stats NZ data for the good of New Zealand.
The IDI is part of a wider data ecosystem both within and beyond government that will deliver more efficient and effective services through better data-based evidence about what works for New Zealanders.
For more information about Stats NZ Integrated Data
Email: access2microdata@stats.govt.nz
Note
Integrated Data featured in the Digital Government Showcase, which was part of Digital 5 2018, the 4th annual gathering of the world's most advanced digital nations that NZ hosted in February 2018.