In GIS we sent out a survey to see where agencies are with their web analytics capability. We wanted to find out what agencies need to improve their services with user data, and what support could look like.
We asked about:
- analytics capability and how it’s used to improve government websites
- blockers to using analytics, and solution and support ideas
- demand for the Google Analytics premium account GA360
- interest in public dashboards.
The results have shown that it’s a real mixed bag, agencies have very different capabilities and needs. One thing that’s clear is the demand for more analytics support, tools and upskilling — 81% of respondents would like help.
52 people responded to the survey. 14 had roles that worked directly on websites, mostly managing content. Half of these respondents were from the Ministry of Primary Industries, which skews the results towards this organisation. The other 38 respondents held either advisor or management roles.
Current use of analytics
Most agencies are using data which is really encouraging. 96% of survey respondents have used analytics, and the majority (64%) can look at pageviews and user counts. A large proportion (42%) use advanced techniques such as creating segments, reports and goals but only 13% would call themselves experts.
In terms of how analytics are used, 79% of respondents track analytics regularly, over half have defined goals for their website and 81% have used analytics to improve their website. This shows that there’s a depth of existing knowledge and experience in Government that can be shared.
Figure 1 shows most respondents use analytics daily, weekly or monthly.

Detailed description of figure 1
This bar graph shows how often the respondents use analytics. Fifty one people answered this question and 1 person skipped it.
The graph shows the % of respondents who use analytics at various frequencies:
- 21% daily
- 39% weekly
- 18% monthly
- 14% once in a blue moon
- 2% never
- 6% other.
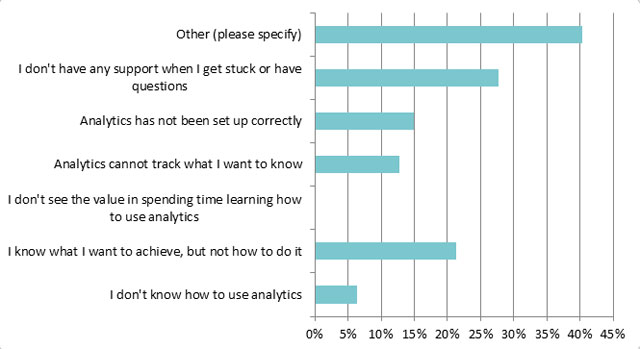
The third section of the survey gathered feedback on the kind of help needed. 79% of respondents identified barriers, and the most common was not being able to use analytics to its full potential. People didn’t have enough support, or knew what they wanted to achieve but not how to do it.
Are there any barriers for you using analytics?
Figure 2 shows 49% of people find a barrier in not being able to use analytics to its full potential.

Detailed description of figure 2
This bar graph shows any barriers to respondents using analytics. The respondents answered:
- 28% said "I don't have any support when I get stuck or have questions"
- 15% said "Analytics has not been set up correctly"
- 13% said "Analytics cannot track what I want to know"
- 0% said "I don't see the value in spending time learning how to use analytics"
- 21% said "I know what I want to achieve, but not how to do it"
- 6% said "I don't know how to use analytics".
What areas of help would you like?
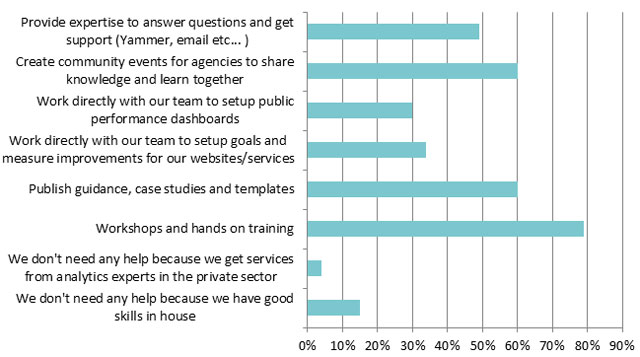
Figure 3 shows the highest demand of help is for workshops and hands on guidance.

Detailed description of figure 3
This bar graph shows what areas of help people would like in using analytics. The respondents answered:
- 49% wanted expertise to answer questions and get support
- 60% wanted community events for agencies to share knowledge and learn together
- 30% wanted to work directly with our team to setup public performance dashboards
- 34% wanted to work directly with our team to setup goals and measure improvements to their websites/services
- 60% wanted published guidance, case studies and templates
- 79% wanted workshops and hands on training
- 4% don't need any help because they get services from analytics experts in the private sector
- 15% don't need any help because they have good skills in house.
Demand for Google Analytics 360
We wanted to find out whether there’s a need for premium analytics tools, specifically Google Analytics 360 (GA360). This is a suite of cloud software tools, including Google Analytics with data constraints removed, and with the data being owned by the licence holder. The results indicate that agencies don’t know what GA360 offers, and what benefits it would bring to them — 77% of respondents either thought it could be useful, or just didn’t know.
Given that users were unclear on the benefits of GA360, we need to communicate these and gather feedback before going any further down the subscription path.
Cross-agency user journeys
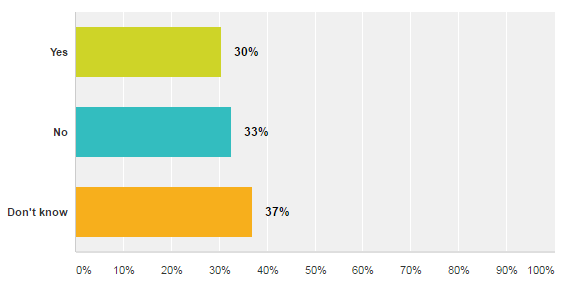
We questioned whether agencies need to track cross-user journeys, and this provided inconclusive results with an even spread of yes 30%, no 33% and don’t know 37%. This indicates a need to better explain the need to track users journeys across the Government web domain. One of the big pain points for users is that there are hundreds of agency sites, and they often need to navigate more than one site to complete a government-related task. When agencies don't collaborate it results in disjointed and confusing user journeys. Victoria Wray along with the GIS Services team is doing some great work on this already.
Do you have a need to track users across the websites of multiple government organisations?
Figure 4 shows the highest proportion of people don't know whether they need to track cross-agency journeys.

Detailed description of figure 4
This bar graph shows if agencies need to track users across the websites of multiple government organisations. The agencies answered:
- 30% yes
- 33% no
- 37% don't know.
Public performance dashboards
The last section aimed to capture views on public performance dashboards. The opinion on public dashboards was mixed — 58% saw value in these, but only 26% thought their agency was likely to be interested. So we’ll need to explore this further as well. Concerns were mainly around privacy, and purpose, and respondents noted that comparing agency performance will be difficult as ‘one size does not fit all here’.
Interviews and next steps
We also held interviews with 18 agencies to understand the nuances of their analytics needs. From these we were able to understand that different agencies have very different capabilities — some agencies are using advanced analytics techniques and can share their skills and experience with other agencies. Whereas some agencies need support to get started.
We're currently exploring ways in which GIS can help support agencies with their analytics needs. In the meantime we can start talking and sharing more — it clear that there's a range of people who are willing to share their expertise and those who want to soak it up, so if anyone wants to help start a community let us know!


