Evaluating digital inclusion initiatives: Examples of good practices
Purpose and context
This document presents several case studies that demonstrate good practices in evaluation of digital inclusion initiatives.
We hope that providers, funders and evaluators of digital inclusion initiatives can draw on this for ideas about how to evaluate.
This document does not attempt to duplicate the many excellent already existing ‘how-to’ resources on evaluation. Instead it draws primarily on one such resource: Superu (2017) Making Sense of Evaluation: A handbook for everyone.[Footnote 1] If you‘re not already familiar with evaluation methods, we recommend that you read the Superu handbook first, and then read this report for some examples of evaluation of digital inclusion initiatives. If you are already familiar with evaluation, you may not need to read the Superu handbook first.
Note: This handbook is our primary reference document; it was written specifically for the New Zealand social sector, is well regarded internationally, and is accessibly written, having won best public sector document in the 2017 New Zealand Plain English Awards.
Structure of this report
What is evaluation? — explains the importance of evaluation and how it can influence decisions.
What are digital inclusion initiatives? — defines digital inclusion initiatives and introduces several main types.
Six key evaluation practices — describes 6 key practices in evaluation. For each key practice you will also find links to:
- the case studies (in this document) of evaluations that demonstrate the practice
- external resources including Superu (2017),[Footnote 2] guidance on Māori evaluation,[Footnote 3] and guidance on evaluation methods.[Footnote 4]
Evaluation case studies — contains the 9 case studies of evaluations of digital inclusion initiatives.
What is evaluation?
Evaluating digital inclusion initiatives: How can we get better evidence for what works? defines evaluation and provides options for supporting the evaluation of government and non-government digital inclusion initiatives.
What are digital inclusion initiatives
We define digital inclusion initiatives as services, projects or programmes that contribute to enabling everyone to conveniently and confidently use digital devices and the internet, via improving motivation, access, skills or trust.
Based on a stocktake of government and non-government initiatives, we have identified 4 main types of digital inclusion initiative currently operating in New Zealand.
Six key evaluation practices
Six good practices in evaluation of digital inclusion initiatives are described along with several case studies that demonstrate these good practices.
1. Constructing a logic model
Superu (2017) pp 11–25[Footnote 5]
A logic model is a diagram of how an initiative is expected to lead to its intended outcomes.
There are many different ways to draw a logic model, and they usually include depictions of:
- the issues or problems the initiative is trying to solve
- the inputs into the initiative (for example, money and time), and the activities that are carried out as part of the initiative
- the outputs from the activities (things that are produced by the initiative, such as people trained, or internet connections established)
- the outcomes, which are the changes that the initiative contributes to. For example, this could include improved digital skills among people who were trained, improved educational or social outcomes among those people, and national level changes such as improved economic productivity.
Logic models often depict several levels of outcomes, ranging from the short-term outcomes that the initiative affects quite directly, through to intermediate and longer-term outcomes that the initiative contributes to alongside many other factors.
Logic models:
- have uses in programme planning and management as well as evaluation
- can provide a common reference point to help people understand where effort should be targeted, what they are doing and why
- help monitoring and evaluation by clarifying what things are important to measure, and when.
Case studies
- Evaluation of Computers in Homes (Aotearoa New Zealand)
Initiative type: Connectivity and skills for low income families with children - Evaluation of Get IT Together (United Kingdom)
Initiative type: Basic skills for adults - Evaluation of the Superfast Broadband Programme (United Kingdom)
Initiative type: Connectivity for everyone
2. Specifying the evaluation’s key questions or objectives
Superu (2017) pp 38–39[Footnote 6]
Every evaluation needs to be clear about its scope and to specify its objectives or key questions. Key questions and objectives are the same; you can choose either, depending on whether you prefer questions or statements.
Key questions are the overarching questions that the evaluation is designed to answer. They aren’t the specific questions asked in an interview or a questionnaire. The purpose of the key questions is to make it easier to decide what data to collect, how to analyse and report it.
Generally, you will have only a few key questions or objectives, but each may have sub-components with more detail.
Case studies
- Evaluation of Aotearoa People’s Network Kaharoa (APNK) (Aotearoa New Zealand)
Initiative type: Connectivity for everyone - Evaluation of Phase 1 of the Widening Digital Participation initiative (United Kingdom)
Initiative type: Basic skills for adults
3. Māori evaluation approaches
As described by Barnes (2009),[Footnote 7] there are many different names for Māori evaluation. These include:
“culturally responsible evaluation, culturally appropriate evaluation, culturally sensitive evaluation, Māori-relevant evaluation, Māori-focused evaluation, Māori models of evaluation, Kaupapa Māori, Māori evaluation tools, Māori frameworks, Māori paradigms, and indigenous protocols for evaluation.”
Barnes uses the term ‘Māori evaluation’ to describe evaluation that is carried out by Māori:
“Either the evaluators are all Māori or the evaluation is, at a minimum, controlled by and owned by Māori.”
Māori evaluation is usually placed within the context of value and power, and can be distinguished from non-Māori evaluation, in that it:
- is controlled and owned by Māori
- meets Māori needs (although it may meet other needs as well)
- is carried out within a Māori worldview, which is likely to question the dominant culture and norms
- aims to make a positive difference.
In Māori evaluations (as in non-Māori evaluations) methods should be chosen to suit the circumstances. Barnes (2009) states:[Footnote 8]
“Methods and approaches firstly need to suit the purpose for which they are being used. For this reason we are not suggesting that there is a standard or defined set of methods or tools that make up Māori evaluation.”
While there is not a standard set of methods, some common themes do emerge in relation to the methods used in Māori evaluations:
- Methods are underpinned by tikanga. The way in which the evaluation is carried out is as important as its outcomes.
- Kanohi ki te kanohi (face-to-face) methods are often more appropriate than telephone or internet-based data collection methods.
- There are some approaches that Māori and others would deem unethical, such as taking information from Māori without consideration of Māori ownership or the use of the information, and with Māori being merely participants without control.
Māori evaluators have often adapted or created new methods, sometimes drawing on local iwi knowledge, to work better with Māori participants and Māori initiatives.
Case study
Evaluation of Te Puāwai o te Ahi Kaa (Aotearoa New Zealand)
Initiative type: Non-digital inclusion
Note: We were unable to find a Māori evaluation of a digital inclusion initiative, so present a non-digital inclusion example instead.
4. Developing indicators and collecting evidence
Developing indicators
Superu (2017) pp 26–36[Footnote 9]
Indicators are things that you can measure, or show to have occurred, that provide evidence for a change. For example, indicators of outcomes from a digital literacy course might include:
- test results that measure changes in participants’ skills before and after the course
- the proportion of participants who applied for jobs online after the course (for employment-related initiatives).
Your choice of indicators will be guided by your logic model and key questions/objectives.
While indicators are quantitative, in many cases you can use them to assess qualitative change. For example, it’s hard to quantify happiness or wellbeing, but you can count the number of people who report an increase, and you can ask them to estimate how much it has increased by.
It’s often helpful to supplement your indicators with qualitative insights. This can help you understand how and why the changes that your indicators show occurred, and what those changes actually mean for people.
Collecting evidence
There are many methods for gathering quantitative and qualitative evidence. The method you choose needs to be a good fit with the indicator or key question you are addressing, and it should be delivered in a way that makes it easy for participants to engage (for example, an online survey may not be appropriate for people who lack digital skills).
Better Evaluation (n.d.)[Footnote 10] describes a number of methods for collecting evidence. It includes ways to:
- collect information from individuals (such as surveys and interviews)
- collect information from groups
- make observations and physical measurements
- re-use existing records and data.
In general, if you can answer your key questions by re-using existing data (rather than collecting new data) it will lower the evaluation’s costs and burden on participants.
Case studies
Re-using existing data:
- Evaluation of Manaiakalani (Aotearoa New Zealand)
Initiative type: Connectivity and skills for low income families with children
Surveying participants:
- Evaluation of Computers in Homes (Aotearoa New Zealand)
Initiative type: Connectivity and skills for low income families with children - Evaluation of Aotearoa People’s Network Kaharoa (APNK) (Aotearoa New Zealand)
Initiative type: Connectivity for everyone - Evaluation of Phase 1 of the Widening Digital Participation initiative (United Kingdom)
Initiative type: Basic skills for adults
Collecting qualitative insights:
- Evaluation of Manaiakalani (Aotearoa New Zealand)
Initiative type: Connectivity and skills for low income families with children - Evaluation of Te Puāwai o te Ahi Kaa (Aotearoa New Zealand)
Initiative type: Non-digital inclusion - Evaluation of Phase 1 of the Widening Digital Participation initiative (United Kingdom)
Initiative type: Basic skills for adults
5. Understanding whether you made a difference
- Superu (2017) p 29[Footnote 11]
- Better Evaluation (n.d.)[Footnote 12]
For any evaluation, it’s critical to understand whether the effects that you observe have been caused by the initiative or by something else. This is called ‘attribution’ or ‘additionality’ and when investigating it, we ask:
- How certain can we be that the initiative contributed to the outcomes?
- How much of the change can be attributed to the initiative, as opposed to other causes?
Attribution is notoriously difficult to measure for social initiatives, but there are ways of estimating it and it’s important to decide how you will do so early on, so that you can collect the relevant information.
There are a number of methods for estimating attribution, which fall into 2 main categories:
- Checking that the results are consistent with what would be expected if the intervention were contributing to the observed changes and investigating whether other causes can be ruled out. This addresses the certainty of attribution, as asked in question 1 above.
- Comparing the results to a comparison group. You can randomly separate potential participants into 2 groups: one that participates in the initiative, and another (the comparison group) that does not. Or you can track a matched comparison group who are as similar as possible to the participants. This addresses questions 1 and 2 above.
Case studies
Randomly selecting potential participants into groups that do and do not participate in the initiative:
- Evaluation of Code Club (United Kingdom)
Initiative type: Skills training (but more advanced than basic digital inclusion)
Comparing with a matched comparison group who are as similar as possible to the participants:
- Evaluation of the Superfast Broadband Programme (United Kingdom)
Initiative type: Connectivity for everyone
Comparing with national statistics over the same time period:
- Evaluation of Manaiakalani (Aotearoa New Zealand)
Initiative type: Connectivity and skills for low income families with children
Checking that the results are consistent with causal contribution and investigating other explanations for the change:
- Evaluation of Manaiakalani (Aotearoa New Zealand)
Initiative type: Connectivity and skills for low income families with children
6. Assessing return on investment
- Superu (2017) p 32[Footnote 13]
- Better Evaluation (2017)[Footnote 14]
Some evaluations investigate return on investment, comparing the value of what the initiative has achieved with its costs.
There are several main approaches for assessing return on investment:
- Cost-benefit analysis (CBA) compares the total monetary cost of the initiative to the monetary value of its benefits.
- Social Return on Investment (SROI) is a type of CBA that estimates the monetary value of a wide range of social and environmental costs and benefits.
- Cost Effectiveness Analysis (CEA) expresses costs in monetary units and benefits in another type of unit such as ‘number of lives saved’.
Evaluating return on investment can take a ‘light touch’ approach, where rough calculations indicate the possible return. Or at the other end of the spectrum, return on investment can be estimated more rigorously with large and technically sophisticated studies that may be very expensive. When deciding to assess return on investment, thought needs to be given to the level of effort that is appropriate.[Footnote 15]
Case studies
- Evaluation of Phase 1 of the Widening Digital Participation initiative (United Kingdom)
Initiative type: Basic skills for adults - Evaluation of Get IT Together (United Kingdom)
Initiative type: Basic skills for adults
Evaluation case studies
Evaluation of Manaiakalani (Aotearoa New Zealand)
Manaiakalani is a digital learning programme that aims to improve year 1 to 13 students’ engagement and outcomes in speaking, listening, reading and writing. Its key objective is to empower students with an evidence-based belief that their voice is valuable, powerful and can be heard around the planet from their decile 1 communities. Technologies that enable this are key to the programme, and Manaiakalani integrates a learning pedagogy, individual access to affordable devices, and community Wi-Fi to allow home connectivity. As of early 2019, Manaiakalani is operating in approximately 90 schools across New Zealand.
Since 2012, Manaiakalani has partnered with the Woolf Fisher Research Centre at the University of Auckland to evaluate, research and develop the programme.
Key evaluation practices demonstrated by the Manaiakalani evaluation
The Manaiakalani evaluation demonstrates:
- Analysis of existing data — student achievement data, collected through standard school assessment processes, was analysed.
- Understanding whether the programme made a difference using comparisons to national statistics — changes in Manaiakalani student achievement over time were compared to national measures of student achievement, looking for acceleration of Manaiakalani student progress relative to national norms.
- Collection of qualitative insights — classroom observations were used to investigate changes in teaching practices, and case studies were used to understand patterns of whānau/family engagement and factors that contributed to successful teaching
- Checking the results are consistent with causal contribution and investigating other explanations for the change — detailed investigations of student achievement and classroom observation data looked at whether the evidence supported the idea that Manaiakalani contributed to the accelerated student achievement.
Evaluation reports
- The 3 reports that we draw on specifically are:
- McNaughton (2017). Value proposition[Footnote 16]
- Jesson, McNaughton, Rosedale, & Zhu (2014). Manaiakalani Evaluation Programme[Footnote 17]
- Jesson et al (2016). Manaiakalani Whānau Capability Building and Classroom Instruction[Footnote 18]
- Manaiakalani
Analysis of existing data on student outcomes and comparisons with national statistics
To investigate Manaiakalani’s effect on student outcomes, the evaluation used NCEA results and standard measures of student achievement in writing, reading and mathematics. Datasets were obtained from national sources (such as the New Zealand Council for Educational Research), or directly from schools (for NCEA results). The researchers then cleaned the data to check for problems such as incomplete entries and duplicates, and organised it so that they could see changes over time for each cohort of Manaiakalani students.
The researchers compared Manaiakalani student achievement to national norms over the same period. But they didn’t just look for better achievement than national norms, which would be unfair given that Manaiakalani operates in mostly decile 1 schools, whose students tend to achieve below national norms. Instead they looked for acceleration of Manaiakalani student progress. That is, they asked whether Manaiakalani students improve faster and start to catch up to national norms.
For some measures they found that this was the case. For example, 2012 to 2014 Manaiakalani students showed accelerated progress in writing. In figure 1, the continuous grey line shows national student progress in writing scores, while the red, blue, green and orange lines show the faster Manaiakalani student progress.

Detailed description of the image
This line graph shows the overall e-asTTIe writing scores for year 4 to year 10 school students and compares the progress of Manaiakalani students with national norms (which indicate how the average student in New Zealand progresses).
In term 1, 2012, Manaiakalani student e-asTTIe writing scores are seen well below national norms.
Over the following 3 years Manaiakalani students’ rate of progress can be seen to rise faster than the national average.
By term 4, 2014, their scores are considerably closer to (although still below) the national norms.
Reproduced, with permission, from figure 1, Jesson et al. [2014][Footnote 19]
Collection of qualitative insights
Observations of classroom practices
To investigate whether Manaiakalani was associated with changes in teaching practices, the researchers carried out classroom observations over time, sitting in on classes taught by a representative sample of teachers. Observers recorded the types of teaching practices and student activities that took place, using a standard categorisation.
They saw changes in teaching practices, such as shifts from closed questioning practices to more extended open discussions, and an increased use of digital learning environments.
Case studies of whānau and family engagement and highly successful teachers
There has also been case study-based qualitative work to investigate aspects of how the Manaiakalani works, to inform improvement and to develop a wider knowledge base. Two examples are:
- Case studies of 8 of the most successful Manaiakalani teachers were used to build an understanding of what highly effective teaching looks like within the Manaiakalani environment. The case studies used classroom observations, student blog posts and the teachers’ online planning as data sources.
- Case studies with 8 parents/caregivers investigated how families and whānau engage in students’ learning. This led to the development of the Fanau Engagement hypothesis, which describes patterns of family and whānau involvement in learning, and factors that influence those patterns.
Checking that the results are consistent with causal contribution and investigating other explanations for the change
Although the changes in student achievement and classroom practices coincided with the Manaiakalani programme, it’s possible that other factors may have been responsible for those changes. To investigate this, the researchers delved into the detail of their findings. Some of the things they found were:[Footnote 20]
- Improvements in student achievement coincided with positive changes in classroom practices.
- Stronger student improvements in writing (as compared to other areas) coincided with a period during which Manaiakalani focused on writing skills. There is also international evidence that digital initiatives such as Manaiakalani most strongly affect writing skills.
- There was an increase in the percentage of classrooms whose students achieved at or above national norms, indicating that the improvements didn’t result solely from already well-performing classrooms getting more of their students to higher achievement levels.
- There was no drop in the size of the cohort (and some evidence for increased retention) from year 11 to year 12, indicating that the improvements at this level cannot be explained by lower-achieving students leaving Manaiakalani schools.
- There was evidence for a ‘dose-response’. That is, students who had been in Manaiakalani classrooms for longer showed higher cognitive engagement.
These findings increase our confidence that Manaiakalani contributed to the observed improvements in student achievement.
Evaluation of Computers in Homes (Aotearoa New Zealand)
The Computers in Homes programme provided training, a digital device, home internet and technical support to the families and caregivers of students in low-decile schools.
The 20/20 Trust operated the programme, which was funded by several government agencies, for 17 years. The funding included a specific provision for evaluation based on surveys of participating families. A total of 18,695 families participated in the programme from the initial pilot in 2000 until government funding ended in 2017.
Key evaluation practices demonstrated by the Computers in Homes evaluation
The Computers in Homes evaluation demonstrates:
- Constructing a logic model — a 2015 evaluation of Computers in Homes developed a logic model that situated the programme in the broader context of digital inclusion in New Zealand. The logic model helped to clarify the range of outcomes that Computers in Homes contributed to, and how it contributed to them.
- Developing indicators and collecting evidence through surveying participants — indicators were developed in the early years of the programme, and data on these indicators was collected through surveying participants at their final training sessions and 12 and 18 months after graduating. To address difficulties with contacting participants (who changed contact details frequently), a random sample was selected for the surveys, and these were contacted every 3 months to check for updated details.
Evaluation reports
Each year, the 20/20 Trust reported their survey findings alongside case studies profiling successful participants:
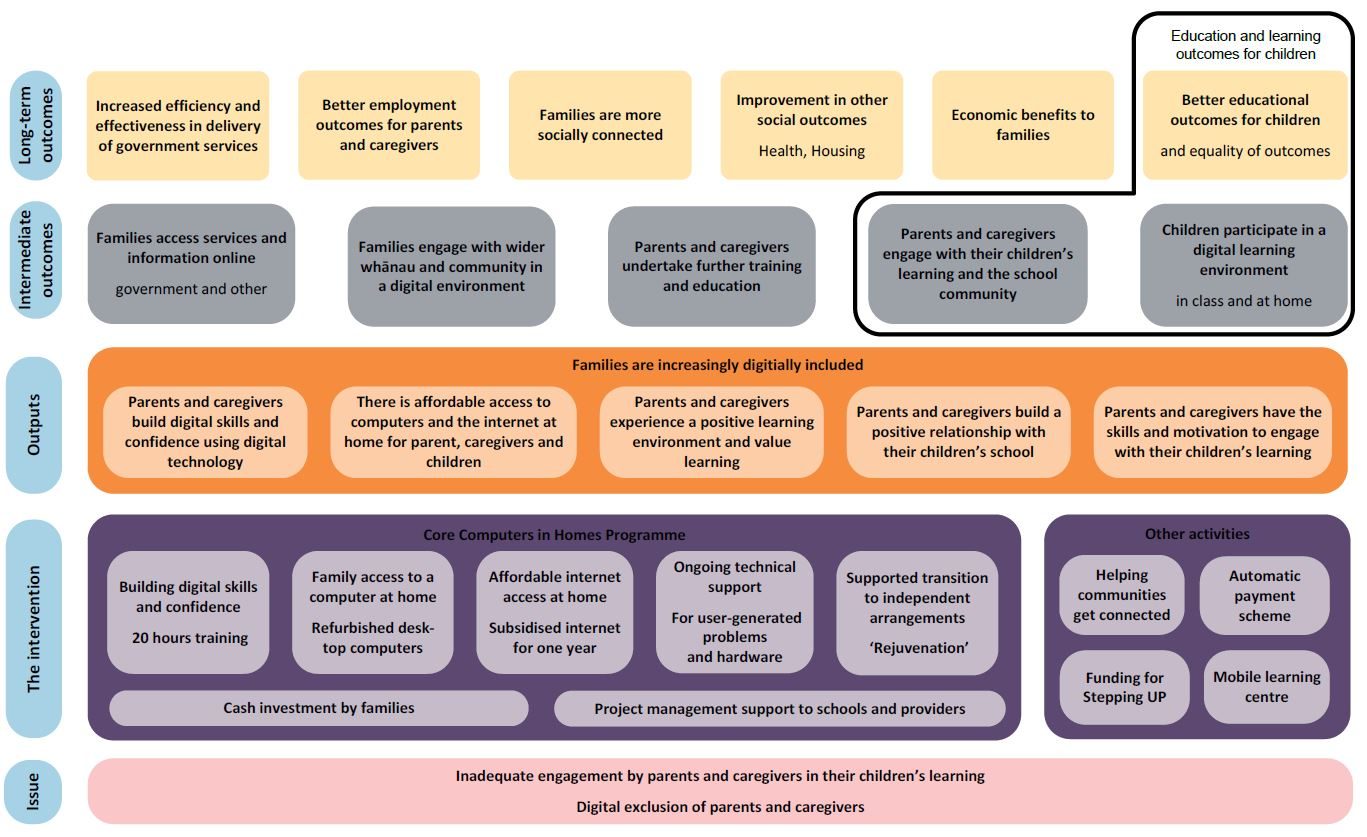
Constructing a logic model
Figure 2 shows the Computers in Homes logic model. It should be read from the bottom to the top. It starts with a statement of the issues that the initiative intended to address. The next row up (the intervention) describes elements of the programme, plus other related activities. On the next row, outputs from the programme are described, including improved digital skills, affordable access to computers and the internet, and parental engagement. The intermediate and long-term outcomes describe the intended contributions of Computers in Homes to educational, social, economic, employment and government service delivery outcomes.
The logic model was used by the evaluation to:
- clarify that the Computers in Homes’ objectives for education and learning outcomes for children formed only a subset of the wider set of possible outcomes
- demonstrate alignment between Computers in Homes and various government priorities.

Detailed description of graph
This image presents a visual logic model for the Computers in Homes initiative. It starts at the bottom by listing the issues that the initiative seeks to address. Following this are listed the interventions, then the outputs finishing with the intermediate outcomes, and then the long-term outcomes.
Issues
- Inadequate engagement by parents and caregivers in their children’s learning
- Digital exclusion of parents and caregivers
Interventions
- Core Computers in Homes programme:
- Building digital skills and confidence — 20 hours training
- Family access to a computer at home — refurbished desk-top computers
- Affordable internet — subsidised internet for 1 year
- Ongoing technical support — for user-generated problems and hardware
- Supported transition to independent arrangements — ‘Rejuvenation’
- Other activities:
- Helping communities get connected
- Automatic payment scheme
- Funding for Stepping UP
- Mobile learning centre
Outputs
- Families are increasingly digitally included:
- Parents and caregivers build digital skills and confidence using digital technology
- There is affordable access to computers and the internet at home for parents, caregivers and children
- Parents and caregivers experience a positive learning environment and value learning
- Parents and caregivers build a positive relationship with their children’s school
- Parents and caregivers have the skills and motivation to engage with their children’s learning
Intermediate outcomes
- Families access services and information online — government and other
- Families engage with wider whānau and community in a digital environment
- Parents and caregivers undertake further training and education
- Parents and caregivers engage with their children’s learning and the school community*
- Children participate in a digital learning environment — in class and at home*
Long-term outcomes
- Increased efficiency and effectiveness in delivery of government services
- Better employment outcomes for parents and caregivers
- Families are more socially connected
- Improvement in other social outcomes – health, housing
- Economic benefits to families
- Better educational outcomes for children – and equality outcomes*
* These 3 outcomes have been connected in the graphic under the heading: Education and learning outcomes for children.
Developing indicators and collecting evidence through surveying participants
Early survey development
In the early years of Computers in Homes, researchers attended graduations where they surveyed participants using paper-based questionnaires. The researchers returned 12 months later to conduct face-to-face follow-up interviews with participants. The indicators were developed through this process, and the surveys moved online in 2009.
2009-onwards surveys of Computers in Homes participants
To gather data on outcomes for families and whānau, participants were surveyed at their final training sessions, and again 12 and 18 months later. The 12- and 18-month surveys were used to look for outcomes that take time to become evident, such as effects on education and employment.
The survey that participants completed at their final training sessions asked for:
- demographic information (including gender, age, ethnicity, region, education level and employment information)
- information on other members of the household, including the number of people, the employment status of adults, the children’s ages and the number of children who will use the device for school or project work
- feedback on the Computers in Homes training, including how well it was organised, the pace of the course, the helpfulness of trainers, and how much value they felt they got from it.
Twelve and 18-month surveys asked for similar information and also investigated outcomes in 5 areas.
1. Ongoing internet access
- Whether they currently had an active internet connection, and if so, what type.
- Whether they took up the internet connection offered at graduation from Computers in Homes, and whether they had retained that connection.
- For those who had not got or retained a connection, why they had not done so.
- What type of device they took home from Computers in Homes and what other computers or smart devices were in the household.
- To what extent they used the internet outside of home.
- Whether they had experienced technical issues.
2. Further education and training outcomes
- Whether participants had enrolled in further education or training since graduating from Computers in Homes, and if so, what type.
- Whether participants had gained any new qualifications since graduating from Computers in Homes.
- For those who had undertaken education or training, whether the computer and training from Computers in Homes had helped with it.
3. Employment outcomes
- Whether participants or other adults in the household had seen any improvements in their employment situations since graduating from Computers in Homes (for example, a new paid job or a promotion).
- For participants in paid work, whether the computer and training from Computers in Homes had helped them to find that work, and if so, what aspects of the training helped.
4. Communication and internet use outcomes
- The extent to which participants now used online methods to keep in touch with whānau and friends, to read the news, transact, to look at government websites, and to search for information.
- The extent to which the children used the computer for school work.
Tracking highly transient participants for the 12- and 18-month follow-up surveys
The follow-up surveys were difficult due to the high transiency rates among Computers in Homes families. This is a common challenge with evaluating outcomes for lower socio-economic groups. In the early years of the survey, families that had moved could not be contacted for the 12- and 18-month follow-up surveys. This was a problem because it reduced the sample size and it may have biased the results towards families in more stable situations (who could have better outcomes).
To address this, the researchers randomly selected a sample of 200 graduates for the survey (instead of attempting to survey all graduates). From this sample, 5 to 10 families were assigned to each Computers in Homes coordinator, who contacted them every 3 months to check for updated contact details. If a family could not be located or declined to participate, that family was replaced by the next name on the random sample list for that region.
This had 2 benefits:
- More families could be retained in the sample, even when their contact details changed.
- Contact with the coordinator maintained a trusted relationship that encouraged participation in the survey.
Evaluation of Aotearoa People’s Network Kaharoa (Aotearoa New Zealand)
Aotearoa People’s Network Kaharoa (APNK) provides free access to broadband internet and computing equipment in public libraries and marae, with the goal of allowing everyone to benefit from accessing, experiencing and creating digital content. APNK provides its partner organisations with:
- computing equipment, such as desktop PCs, printers, Wi-Fi, hosted digital repositories, scanners, and PC reservation systems
- a managed service with software updates, and network monitoring and maintenance
- a filtered internet service that blocks objectionable material and malicious software
- technical support
- an online networking site for staff
- training for staff in the digital tools likely to be used by library customers.
APNK was evaluated in 2008 and 2011.
Aotearoa People's Network Kaharoa
Key evaluation practices demonstrated by the APNK evaluation
The 2011 APNK evaluation demonstrates:
- Specified evaluation objectives — the report specifies the 5 key issues that the evaluation sought to understand.
- Collecting evidence through surveying initiative participants — APNK users were surveyed, and survey findings were used (alongside findings from other methods) to understand the 5 key issues.
Evaluation reports
- All APNK evaluation reports
- The report that we draw on specifically is:
Simpson Edwards & Associates (2011).[Footnote 22]
Evaluation objectives
The evaluation sought to understand 5 issues.
- The extent to which the APNK has enhanced equity of access in the digital world.
- The extent to which people are benefiting from having access to the digital world (including enhanced social, cultural and economic wellbeing).
- The extent to which the skills and knowledge of library staff and the wider community have been enhanced.
- The extent to which the overall value proposition of libraries or marae have been enhanced.
- The overall quality of service provided (including how the APNK was rolled out and whether libraries perceive they are receiving value).
Of particular relevance to digital inclusion, these objectives focus both on equity of access (objective 1), and on outcomes from access (objective 2). The evaluation sought to understand whether APNK has contributed to enabling everyone to use digital devices and the internet, as well as the social, cultural and economic wellbeing outcomes from that.
The 5 objectives cover a range of issues. Because no single data source could answer all these questions, the evaluation used a mixed-methods approach. Data was collected in several different ways, and findings were synthesised from analysis of all the data sources. The 5 objectives formed a framework that guided the reporting of the results.
The evaluation used 6 methods of collecting data.
- Key informant interviews
- A review of relevant operational and contractual documents
- Case studies with 3 public libraries and 1 marae
- A survey of people who use APNK in libraries
- A survey of library staff
- Analysis of APNK usage data.
Collecting evidence through surveying APNK participants
This survey provides an example of how to gather information from participants in ‘connectivity for everyone’ initiatives. Participants in these initiatives are usually anonymous, creating some challenges for evaluation.
The survey was run online in September and October 2010, and a link to it was advertised on the APNK portal pages. Every APNK user during this time would have been shown the survey link when they started using the library or marae computer, or when they connected their own device to the APNK Wi-Fi. Entry into a prize draw was offered to boost response rates; 426 responses were received.
The evaluation report reproduces the questionnaire in Appendix B, Simpson Edwards & Associates, 2011.[Footnote 23] Survey questions addressed objectives 1, 2, 4 and 5, as summarised below.
Objective 1. Equity of access
- Questions about what other forms of internet access were available to participants revealed the extent to which APNK was providing internet for people who would not be digitally included otherwise.
- Questions that asked whether people felt that they could access online communities and information that they couldn’t access before, addressed equity of access. The evaluation also looked at differences in responses to these questions by age, gender, ethnicity and previous computer training.
Objective 2. Benefits from access to the digital world
- Several questions asked about outcomes from using the APNK internet service. These questions investigated improvements in computing skills, participation in training provided by the library or marae, accessing information, feeling part of an online social community and being financially better off.
- Participants were also asked what activities they had used APNK for, such as:
- communicating online with others
- creating content, for example uploading photos or video to websites
- searching for information on training opportunities
- completing assignments or course work
- working on a CV and searching or applying for jobs
- buying or selling online
- online banking
- business communications or transactions
- joining the library
- online gaming
- interactions with government and other forms of democratic participation.
Objective 4. Enhancement of the library and marae value proposition
- Participants were asked how often they had visited the library or marae before they started using APNK, and how often they had visited since APNK became available.
- Various questions asked about participants’ levels of support for APNK and their perceptions of the value it provides to users, the library and local businesses.
Objective 5. Quality of service
Participants were asked about their satisfaction with aspects of the service, including support from staff, the speed, reliability and quality of internet access and the available software on APNK computers.
Evaluation of Te Puāwai o te Ahi Kaa (Aotearoa New Zealand)
Te Puāwai o te Ahi Kaa (TPoTAK) was a collaboration between Raetihi Pah and Te Oranganui Trust, a Māori health services provider. Its aim was to strengthen the health and wellbeing of whānau who live locally in Raetihi and maintain the Ahi Kaa, contributing to the future sustainability of the paepae and marae. TPoTAK received funding from the Ministry of Health’s Te Ao Auahatanga Hauora Māori: Māori Health Innovations Fund from 2014 to 2017.
The TPoTAK kaimahi (staff) and kaiwhakahaere (managers) worked with local whānau to develop the TPoTAK project plan. A whānau health survey and needs assessment, alongside kōrero with whānau, resulted in prioritisation of these initial activities:
- coordinating marae-based whānau health checks
- increasing whānau awareness of health and social service providers, their access criteria and referral processes
- increasing awareness of the hereditary health conditions common among whānau
- sharing knowledge and tools to develop and maintain māra kai (food gardens)
- improving communication between whānau and child welfare services.
The TPoTAK partners commissioned Whakauae Research for Māori Health and Development (Whakauae), an iwi-owned research centre, to evaluate the project. Whakauae were seen as a good fit because the evaluation needed to be conducted in a way that would resonate with the Māori worldview underpinning TPoTAK and the Te Ao Auahatanga Hauora Māori Fund.
TPoTAK is not a digital inclusion initiative, but its award-winning evaluation is included here because it is a good example of a kaupapa Māori evaluation, and because we have not yet found any explicitly Māori evaluations of digital inclusion initiatives.
Note: The TPoTAK evaluation won the 2018 Australian Evaluation Society Indigenous Evaluation Award.
Key evaluation practices demonstrated by the Te Puāwai o te Ahi Kaa evaluation
This work demonstrates:
- Kaupapa Māori evaluation — the evaluation used a kaupapa Māori approach, which was controlled and owned by Māori, was rooted in a Māori worldview and included a focus on capability-building and collaboration with the initiative’s kaimahi.
- Collecting qualitative insights using engaging methods that were appropriate for participants and the TPoTAK context.
Evaluation report
The kaupapa Māori approach used in the evaluation of TPoTAK is described in:
Potaka-Osborne, Tuatini, Williams, & Cvitanovic (2018).[Footnote 24]
Development of the kaupapa Māori approach
The evaluation adopted a qualitative evaluation design, under the umbrella of kaupapa Māori theory. This approach required the evaluation to be under Māori control, to be done with Māori, and to deliver benefits for Māori. The evaluation also drew on ways of working inspired by transformative participatory evaluation, which uses evaluation processes and products to transform power relations and promote social action and change.
This approach meant that Whakauae needed to work with TPoTAK and whānau in a way that was transparent and that resonated with Māori beliefs and traditions. The evaluation needed to build purposeful and respectful relationships, to recognise strengths and contribute to positive social change, and to actively involve participants in the evaluation to support their development.
Building capability
The TPoTAK evaluation built Māori capability in 3 main ways.
- The evaluation was led by a Māori evaluator who had experience working within kaupapa Māori evaluation teams, and who was a close cultural fit with the TPoTAK kaimahi and participants, but who up until that time had little experience in a lead role. The evaluator was supported by an experienced Pākehā colleague and developed her skills through the work. This approach was taken in preference to having the evaluation led by someone who was a less close cultural fit.
- TPoTAK kaimahi were involved in data collection and development of evaluation tools. This had the twin benefit of developing their capability as well as engaging their expertise to ensure that the methods were appropriate for participants and useful for TPoTAK.
- TPoTAK kaimahi participated in presenting the evaluation work at conferences. This assisted kaimahi to further develop their knowledge of evaluation and helped the evaluators to learn more about TPoTAK.
Collaboration and transparency
In keeping with kaupapa Māori practices, the lead evaluator met kanohi ki te kanohi (face-to-face) with TPoTAK team in the opening phases of the evaluation and thereafter. Meeting kanohi ki te kanohi prioritised whakawhanaungatanga, trust and relationship building. The Pākehā evaluator, though playing a primarily ‘back office’ role, took part in several hui, in line with the principle of transparency so that all of the faces involved were ‘known and seen’.
Note: Whakawhanaungatanga is the process of establishing relationships, relating well to others.
The lead evaluator worked in consultation with the TPoTAK kaimahi to develop the data collection tools. The tools were developed to be used alongside TPoTAK’s existing work. For example, kaimahi and the evaluator collected data and talked with whānau about the evaluation at the marae’s regular Whānau Days, but this evaluation activity was essentially an ‘add-on’, not the primary focus for these days.
Collecting qualitative insights using whānau-friendly methods
The evaluation developed flexible approaches to collecting data and had a primary focus on ensuring that data collection methods were responsive to the needs of TPoTAK participants. Two examples are:
- A kanohi ki te kanohi whānau survey was developed in which TPoTAK kaimahi visited whānau in their homes, offering support and sharing insights, and exploring whānau perspectives on the progress and impact of TPoTAK. The visits invariably involved a cup of tea and a general kōrero. This approach generated rich data for answering the evaluation questions. It also demonstrated to kaimahi that evaluation processes can be used in ways that resonate with them and their community.
- At the Whānau Days, 1 of the data-collection methods used was mahi a-tēpu (table work) — an adaptation of a muralling technique. Large, low-cost plastic tablecloths were laid on tables in the wharekai with an evaluation question written in the centre of each. Whānau were invited to write or draw responses to the evaluation questions at any time during the day. This method was used because it was interesting and engaging, and because it could run alongside other Whānau Day activities without interfering with the primary purpose of the day. Whānau could sit around the table together and take their time, without pressure to generate instant responses, or to focus only on the evaluation questions.
Evaluation of Code Club (United Kingdom)
Code Club, run by the Raspberry Pi Foundation, is a network of after-school clubs that began in the UK and has now expanded to over 160 countries including New Zealand. Code Club produces materials that support children aged 9 to 11 to learn Scratch, HTML/CSS and Python. The clubs are supported by host schools and volunteers, and usually run for an hour a week after school, with around 15 children per session.
In 2015 to 2016, Code Club UK worked with the National Foundation for Educational Research to evaluate the impact of Code Club on children’s computational thinking, programming skills, and attitudes towards computers and coding.
Key evaluation practices demonstrated by the Code Club evaluation
The Code Club evaluation demonstrates:
- Understanding whether the initiative made a difference by randomly selecting children into groups that did and did not participate in Code Club — this is known as a randomised controlled trial (RCT). Comparing outcomes between the 2 groups allowed the evaluators to quantify the extent to which Code Club made a difference.
Evaluation report
The report that we draw on specifically is:
Straw et al. (2017).[Footnote 25]
Understanding whether Code Club made a difference using an RCT
The evaluation used an RCT to quantify the impact of Code Club on children’s computational thinking, programming skills and attitudes towards computers and coding. Year 5 pupils who signed up to attend Code Club were randomly allocated into an ‘intervention group’, who attended Code Club during the 2015/16 academic year, and a ‘control group’, who did not attend Code Club that year but were assured of a place in the following year.
The 2 groups of children both completed surveys before the intervention group began attending Code Club (at baseline) and again at the end of the year 2015/16 (follow-up). The surveys assessed their computational thinking, programming skills and attitudes towards computers and coding. Changes in these measures between baseline and follow-up were compared between the 2 groups. If Code Club were successful, we would expect to see greater skills increases among the children who attended Code Club, relative to the children in the control group.
An alternative method would have been to compare skills over time between children who participated in Code Club and children who chose not to participate. But this wouldn’t have accounted for pre-existing differences in those children’s interests and motivation. If children who chose to participate in Code Club gained greater skills than those who chose not to participate, would this have been because of what they learned at Code Club, or because they had a higher interest in, and ability with, coding? The RCT removed this source of bias by preventing the children from self-selecting into participant and non-participant groups.
When progress was compared between the children who attended Code Club and the children in the control group, the evaluation found that:
- attending Code Club for a year did not improve children’s computational thinking over and above what would have occurred anyway
- attending Code Club did significantly increase children’s usage of, confidence with, and coding skills in Scratch, HTML/CSS and Python
- the improvement in skills was evident even when the control group children learned Scratch as part of the standard computing curriculum in school.
These results have been used to demonstrate the success of Code Club.
Evaluation of Phase 1 of the Widening Digital Participation initiative (United Kingdom)
Phase 1 of the Widening Digital Participation initiative was a collaboration between the Tinder Foundation (now called the Good Things Foundation) and NHS England. It ran from 2013 to 2016.
The initiative aimed to provide people with digital skills that they could use to take charge of their health. It had a focus on hard-to-reach communities, where health outcomes tend to be worse. Activities included:
- building a digital health information network of hyperlocal providers offering face-to-face support to help people improve their digital skills
- developing health-related digital content for the Tinder Foundation’s Learn My Way platform, to help people access online health information and learn how to complete digital medical transactions
- funding ‘Innovation Pathfinder’ organisations, which tested innovative ways of helping people to improve their digital health skills.
An evaluation of Phase 1 was published in 2016. The initiative has now moved into Phase 2, operating from 2017 to 2020.
Phase 1 of Widening Digital Participation
Key evaluation practices demonstrated by the Widening Digital Participation evaluation
The evaluation of Widening Digital Participation demonstrates:
- Specifying the evaluation’s objectives — the report specifies the 3 key issues that the evaluation sought to understand.
- Collecting evidence by surveying initiative participants — learners were surveyed to gather information about what kinds of people were being reached, and their learning outcomes.
- Collecting qualitative insights — in-depth interviews with staff at the Innovation Pathfinder organisations provided insights on challenges and things that worked well.
- Assessing return on investment — survey findings were combined with estimates of the average cost of health services to generate a rough estimate of the health system savings created by the initiative, relative to its costs.
Evaluation report
The report that we draw on specifically is:
Tinder Foundation (2016).[Footnote 26]
Evaluation objectives
The evaluation had 3 main objectives.
- To understand the reach, effectiveness and impact of programme activities, particularly in relation to the priority audiences: people with learning difficulties, dementia carers, disadvantaged young people, and digitally-excluded people generally.
- To identify successful engagement and delivery models with the potential to be sustainable beyond the life of the programme, with a focus on partnerships.
- To measure the impact of learning about digital health resources on:
-
- the confidence and skills that people have to manage their own health
- the confidence and skills that people have to perform health transactions online
- health and wellbeing behaviours
- health service usage.
Collecting evidence by surveying participants
A survey of the learners who used the digital health-related content gathered information on:
- learner characteristics
- the effects of the initiative on learners, such as whether they felt more informed about their health, whether their confidence in using online tools to manage health had increased, or whether they experienced any changes in feelings of isolation, happiness or self-confidence
- the health-related online activities that learners undertook after training, such as whether they went on to use the internet to find health-related information or explore ways of improving mental health and wellbeing
- The proportion of learners who reported time and money savings from doing things online, rather than in person or on the phone
- the impact of the training on learners’ use of front-line health services, including whether they reported a reduction in visits to the GP and A&E, and whether they had used online methods to find health services, book GP visits, or order repeat prescriptions.
Collecting qualitative insights from interviews with staff
In the third year of the initiative, in-depth semi-structured interviews were held with staff at the Innovation Pathfinder organisations to gain insights into:
- what did and did not work well for the learners that the organisations worked with
- challenges that were encountered
- recommendations for future improvements.
Estimating return on investment
A ‘light touch’ method of estimating return on investment was used, drawing from survey data and existing information on the costs of UK health services. This method only provided a rough approximation of the return on investment, but it’s a straightforward approach that can be used when estimates of service costs already exist.
Figure 3 shows the cost savings calculations from reductions in GP and A&E visits. In the case of GP visits, survey responses indicated that 21% of learners made fewer calls or visits to their GP, with 40% of them saving at least 3 visits over 3 months. Multiplying this by the 81,049 learners in year 3 of the initiative, they estimated that 6,808 people saved 3 visits over 3 months, equating to 81,696 fewer visits per year. Using an existing estimate of the average cost of a GP visit,[Footnote 27] they assigned a monetary value to this, of £3.7m saved.
Return on investment was then estimated by subtracting the cost of the initiative (£810,000) from the health service savings (£6 million) and dividing that total by the cost. This gave a return on investment estimate of 640%, over and above the cost of the initiative.
Figure 3. Health service cost savings calculations for the Widening Digital Participation initiative
(reproduced from Tinder Foundation [2016][Footnote 28])
Cost savings from a reduction in GP visits
81,049 learners x 21% x 40% = 6,808 people
If each of these people saves 3 GP visits in 3 months:
- 6,808 people x 3 visits each =
- 20,424 GP visits saved in 3 months
- 81,696 GP visits saved in a full year
Each GP visit costs £45, therefore the total annual cost saving can be calculated as:
- 81,696 GP visits x £45 = £3.7 million
Cost savings from a reduction in A&E visits
81,049 learners x 6% x 30% = 1,459 people
If each of these people saves 3 A&E visits in 3 months:
- 4,459 people x 3 visits each =
- 4,377 A&E visits saved in 3 months
- 17,508 A&E visits saved in a full year
Each A&E visit costs £132, therefore the total annual cost saving can be calculated as:
- 17,508 A&E visits x £132 = £2.3 million
Evaluation of Get IT Together (United Kingdom)
The Get IT Together programme was established in 2011, through a partnership involving the telecommunications company BT, the charity Citizens Online, Nominet Trust (an investor in social and technology ventures), and Highlands and Islands Enterprise and Communities 2.0 (a regional development investor). It aimed to tackle issues of digital exclusion, to make sure the internet is available to everybody, and to help individuals and communities understand and gain the benefits of being online. At the time of the evaluation, Get IT Together projects operated in 15 locations around the UK, running 5- and 10-week courses for older people, job-seekers, disabled people and people living in rural areas. The courses were aimed at a range of target groups, but older learners made up 80% of participants.
BT commissioned Just Economics to evaluate the success of the programme. Following a review of possible methods, a social return on investment (SROI) approach was selected.
Note: The programme’s approach has changed since the evaluation.
Key evaluation practices demonstrated by the Get IT Together evaluation
The Get IT Together evaluation demonstrates:
- Constructing logic models — following the SROI approach, theories of change for each type of stakeholder were developed to identify their most valued outcomes from Get IT Together. Theories of change are very similar to logic models.
- Assessing return on investment using an SROI method — this type of cost-benefit analysis estimates returns to multiple stakeholder groups and includes difficult-to-quantify benefits.
Evaluation reports
In this section, we discuss the SROI aspect of the evaluation of Get IT Together, which is reported in:
Just Economics (2014).[Footnote 29]
In addition, Harper (2015).[Footnote 30] (including the non-SROI components).
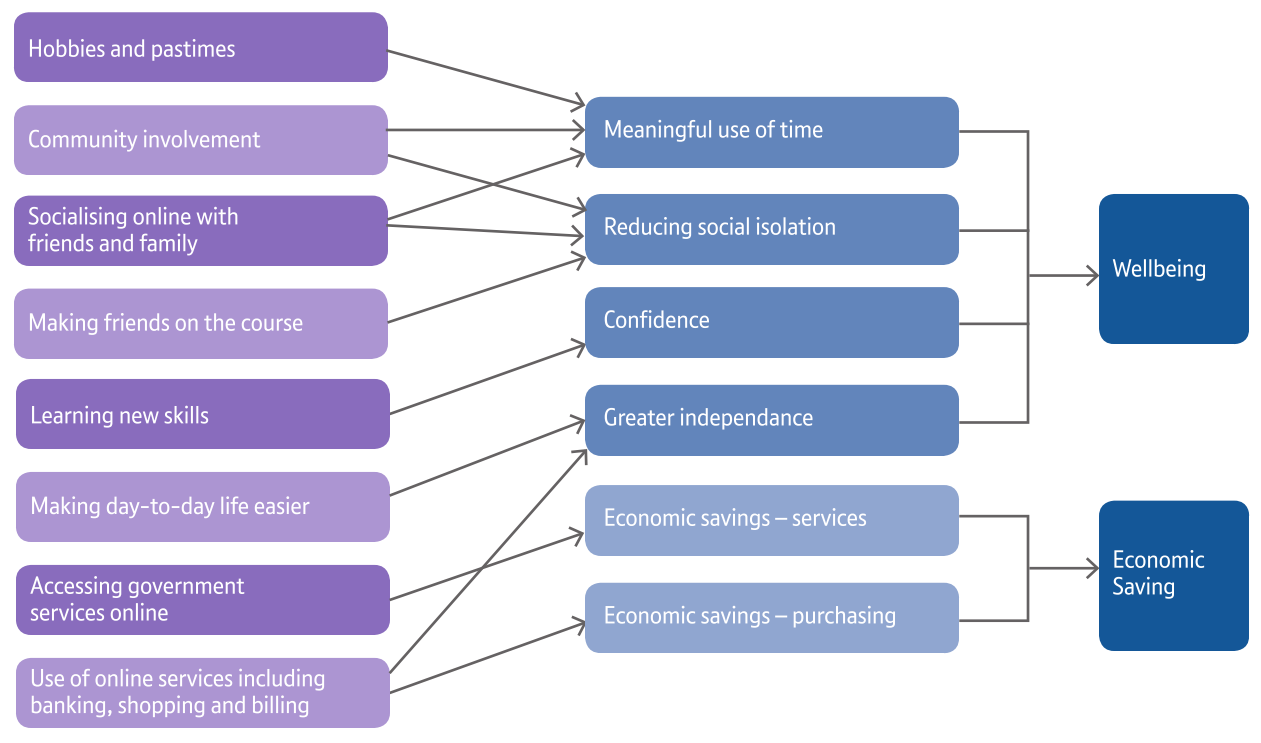
Logic models/theories of change
The evaluators interviewed stakeholders in groups or individually, asking about their perceptions of the benefits from Get IT Together, and what they thought helped or hindered the realisation of those benefits. Findings from these interviews and a document review shaped the development of theories of change for the various groups. Theories of change were developed for older people, job-seekers, Get IT Together volunteers and tutors, and the state.
The theory of change for older people is reproduced in figure 4. It links the activities that were helped by Get IT Together (in the left-hand column) to the short and longer term outcomes from those activities (middle and right-hand columns).
(reproduced from figure 2, Just Economics [2014][Footnote 31])

Detailed description of image
This image presents a flow chart that shows how each of a list of activities, that were helped by the Get IT Together programme, connect to several short-term outcomes. The connection of each short-term to 2 long-term outcomes is then shown.
Activities listed:
- Hobbies and pastimes
- Community involvement
- Socialising online with friends and family
- Making friends on the course
- Learning new skills
- Making day-to-day life easier
- Accessing government services online
- Use of online services including banking, shopping and billing
Short-term outcomes, together with the activities connected to them:
- Meaningful use of time:
- Hobbies and pastimes
- Community involvement
- Socialising online with friends and family
- Reducing social isolation:
- Community involvement
- Socialising with friends and family
- Making friends on the course
- Confidence:
- Learning new skills
- Greater independence:
- Making day-to-day life easier
- Use of online services including banking, shopping and billing
- Economic savings — services:
- Accessing government services online
- Economic savings — purchasing:
- Use of online services including banking, shopping and billing
Long-term outcomes, together with the short-term outcomes connected to them:
- Wellbeing:
- Meaningful use of time
- Reducing social isolation
- Confidence
- Greater independence
- Economic saving:
- Economic savings — services
- Economic savings — purchasing
The evaluators then developed indicators for each outcome, using existing information such as data from the Citizens Online surveys of learners.
For example, the indicator for reduced social isolation was the proportion of learners that, on finishing the course, volunteered to help others with computers or the internet, were more active in their communities, or socialised online. The survey findings indicated that, among older people without computers at home, 106 people had experienced this outcome.
Assessing return on investment using the SROI method
SROI is a form of cost-benefit analysis that compares the value created by an intervention with its costs to assess whether it is good value for money. It differs from conventional cost-benefit analysis in 2 key ways. First, it places monetary values on non-traded benefits, such as quality of life. Secondly, it takes a multi-stakeholder approach rather than measuring returns only to the state or the economy.
Estimating the SROI requires several steps, as described below.
Valuation of outcomes
Where necessary, SROI uses financial proxies to estimate the monetary value of outcomes. This was needed for most of the outcomes identified in the theories of change. For example, the value of reduced social isolation for older people is not easily derived. As a proxy, the evaluation used national survey findings on the amount that older people are willing to spend on recreation and culture. This amount, adjusted for inflation, was £1055.34 per year, per person.
Calculation of additionality
To quantify the extent to which Get IT Together was responsible for each outcome (that is, to calculate the additionality), adjustments were made for 3 factors.
- Deadweight — the level of outcomes that would have occurred anyway, in the absence of Get IT Together.
- Attribution — the proportion of the observed outcomes that are attributable to Get IT Together, as opposed to being attributed to other things that happened alongside Get IT Together, such as help from family and friends.
- Displacement — the extent to which outcomes for learners displaced outcomes that would otherwise have gone to others. This relates only to employment, for example, if learners obtained employment that would have gone to other people.
For the reduced social isolation indicator, deadweight was set at 66%, which is the proportion of people who described themselves as “not lonely” in a UK survey of older people. Attribution was set at 57.5%, which was the proportion of surveyed learners who said the course was the main contributing factor to their outcomes. Displacement was not relevant to the social isolation outcome.
As an example, to calculate additionality for the reduced social isolation indicator for the 106 older learners without computers at home:
- deadweight was accounted for by subtracting 66% from the 106 learners. This adjusted the outcome down to 36 people.
- to account for attribution, 36 was multiplied by 57.5%, adjusting the estimate to 21 people.
- this was multiplied by the value of the outcome (£1055.34), to give an annual value created by Get IT Together of £21,904.16.
Overall calculation of total
The final calculation of the return on investment summed the monetary values across all outcomes and compared this to the expenditure on the initiative. The total value was estimated to be over £1.5 million, compared to an investment of £420,000. This translates to a ratio of 3.7:1, or for every £1 invested in the programme there was £3.70 of social value.
Evaluation of the Superfast Broadband Programme (United Kingdom)
The Superfast Broadband Programme was implemented by the UK government in response to concerns that the commercial deployment of superfast broadband would fail to reach many parts of the country. It was expected that extending coverage to those areas would produce economic, social and environmental benefits.
The evaluation of the programme looked at its impacts between 2012 and 2016, investigating the effectiveness and efficiency of delivery, cost effectiveness, and impacts on firms and citizens. This was a very large and comprehensive evaluation. In this section, we focus only on 1 component of it — the evaluation of the social impacts of the programme.
Key evaluation practices demonstrated by the evaluation of the social impacts of the Superfast Broadband Programme
This work demonstrates:
- Constructing a logic model — describes the potential positive and negative effects of superfast broadband on personal wellbeing.
- Understanding whether the initiative made a difference by comparing participants’ results with a matched comparison group — households in areas that had and had not been upgraded were surveyed about their wellbeing. A technique called ‘propensity score matching’ was used to compare the outcomes for households in upgraded areas with the outcomes for households in non-upgraded areas.
Evaluation reports
- The evaluation had a number of components and was published in several reports:
All reports on the Superfast Broadband Programme - The report about the evaluation of social impacts is:
Ipsos MORI (2018).[Footnote 32]
Logic model of the effects of superfast broadband on personal wellbeing
A literature review of existing research on the social impacts of superfast broadband was undertaken to identify social outcomes that may be associated with the introduction of superfast broadband. This was used to develop the logic model shown in figure 5.
(reproduced from figure 2.2, Ipsos MORI [2018][Footnote 33])

Detailed description of image
This image presents a visual logic model for the UK’s Superfast Broadband Programme. It starts with a list of 3 inputs that result in the output of an ‘increase in superfast broadband coverage’. The model tracks the outcomes, and then impacts that result for those who take up broadband in the home and those who do not.
Note: There are direct outcomes as a result of the outputs that, in turn, lead to indirect outcomes before resulting in impacts. Some direct outcomes result in more than 1 indirect outcome or impact.
Inputs:
- BDUK funding
- Other public funding (e.g. European Regional Development Fund [ERDF])
- Private investment by providers
Two resulting outputs of an increase in superfast broadband coverage
- Take up by consumers and households
- Non-adoption of new technology
Direct outcomes for those who take up broadband:
- More choice and reduced prices through online shopping
- Improved access to public services and businesses
- Ability to stream (more) content
- Increase in social interactions via online social media
- Reduced feeling of injustice/missing out versus rest of country
- Greater social isolation, lower productivity and internet addiction
- Increased incidence of online crime
- Withdrawal of face-to-face services and spaces
Indirect outcomes for those that take up broadband:
- Reduced travel costs (time and money)
- Greater potential for teleworking
- Greater role for telemedicine
- Reduced isolation for vulnerable/remote people
- Greater potential for communities to organise online
- Increased individual and community resilience
Direct impacts that result from the outcomes for those who take up broadband:
- Increased consumption
- More leisure/free time
- Greater range of entertainment/education options
- Improved health
- Increased participation in the job market
- Increased (subjective) personal wellbeing
- Increased community wellbeing
- Decreased (subjective) wellbeing
Note: This impact is only a result of the outcomes of: greater social isolation, lower productivity and internet addiction; withdrawal of face-to-face services and spaces.
Indirect impacts that result from the outcomes for those that take up broadband:
- Increased house prices
Direct outcomes for those that do not adopt new technology:
- Narrowing but deepening of the digital divide
Direct impacts that result from the outcomes for those that take up broadband:
- Decreased (subjective) wellbeing
While the literature review suggested that the balance of impacts was likely to be strongly positive, there was also evidence for negative impacts, such as increased isolation, internet addiction, and a widening digital divide in access to services. Logic models often only include positive outcomes, but sometimes it is helpful for them to specify unintended negative outcomes too. Including negative unintended outcomes can help stop the evaluation from falling into the trap of ignoring unintended results.[Footnote 34]
The logic model was used to prioritise areas for further investigation. In investigating these priority areas, the researchers conducted an econometric analysis of national data as well as interviews with, and a postal survey of, households. The section below describes the postal survey and its use of a matched comparison group.
Understanding whether the initiative made a difference by comparing participants’ results with a matched comparison group
The evaluation used a postal survey to obtain quantitative data on the effects of superfast broadband on households. In partnership with superfast broadband providers, the evaluators conducted a postal survey of households in postcode areas that:
- had been upgraded by the programme
- were not covered by the programme and that were identified in a national dataset as having slower internet connections (<10 Mbps).
They received 1,314 responses: 714 in non-upgraded areas, and 600 in upgraded areas.
To estimate the effects of superfast broadband on social outcomes, survey responses were compared between households in upgraded and non-upgraded areas, using propensity score matching. The evaluators could have simply compared averages across the 2 areas, but this would have been affected by other variables. For example, if employment rates were higher in upgraded postcode areas, this could increase the average wellbeing in those areas, making it appear that superfast broadband caused better wellbeing, when in fact the outcomes were more strongly related to employment.
Propensity score matching works by creating matched pairs between 2 samples. The evaluators used logistic regression to calculate each household’s propensity score. The score is the probability of the household having superfast broadband, as a function of other variables, such as geographical area, age, gender, house price, number of people in the household, the presence of health conditions, employment status, tenure and ethnicity.
The propensity scores were then used to match each household in the upgraded area to its most similar household in the non-upgraded area. Wellbeing outcomes were compared for each matched pair, and the overall difference between the groups was calculated as the average of the differences within each pair.
The survey findings showed no significant differences in wellbeing between the upgraded and non-upgraded areas. However, there were some small differences between the groups in the extent to which they used, and assigned importance to, the internet.
Last updated